12. 监控使用文档
XuperChain 系统集成了Prometheus开源监控框架,用户可以通过Prometheus+Grafana构建自己应用的监控系统,并且用户还可以根据自己的需求定义自己的监控采集项。下面会介绍目前 XuperChain 默认采集的监控项,并指导用户如何搭建自己本地的 XuperChain 开源监控系统。
12.1. XuperChain 监控项
监控项名称 |
监控项含义 |
单位 |
说明 |
|---|---|---|---|
rpc_flow_out |
当前RPC接口上行流量 |
byte |
以链为粒度 |
rpc_flow_in |
当前RPC接口下行流量 |
byte |
以链为粒度 |
p2p_flow_out |
当前p2p网络上行流量 |
byte |
以链为粒度 |
p2p_flow_in |
当前p2p网络下行流量 |
byte |
以链为粒度 |
grpc接口默认监控项系列 |
以链为粒度 |
12.2. XuperChain 监控系统搭建
12.2.1. 搭建网络
搭建网络,节点xchain.yaml配置中打开prometheus 端口,如下所示:
tcpServer:
  # prometheus监控指标端口, 为空的话就不启动
    metricPort: :37200
12.2.2. 使用Prometheus查看监控
prometheus 安装教程:
配置prometheus 设置endpoint服务:
修改 prometheus.yml 文件,添加如下配置,指向prometheus端口:

启动prometheus:
nohup ./prometheus –config.file=prometheus.yml &
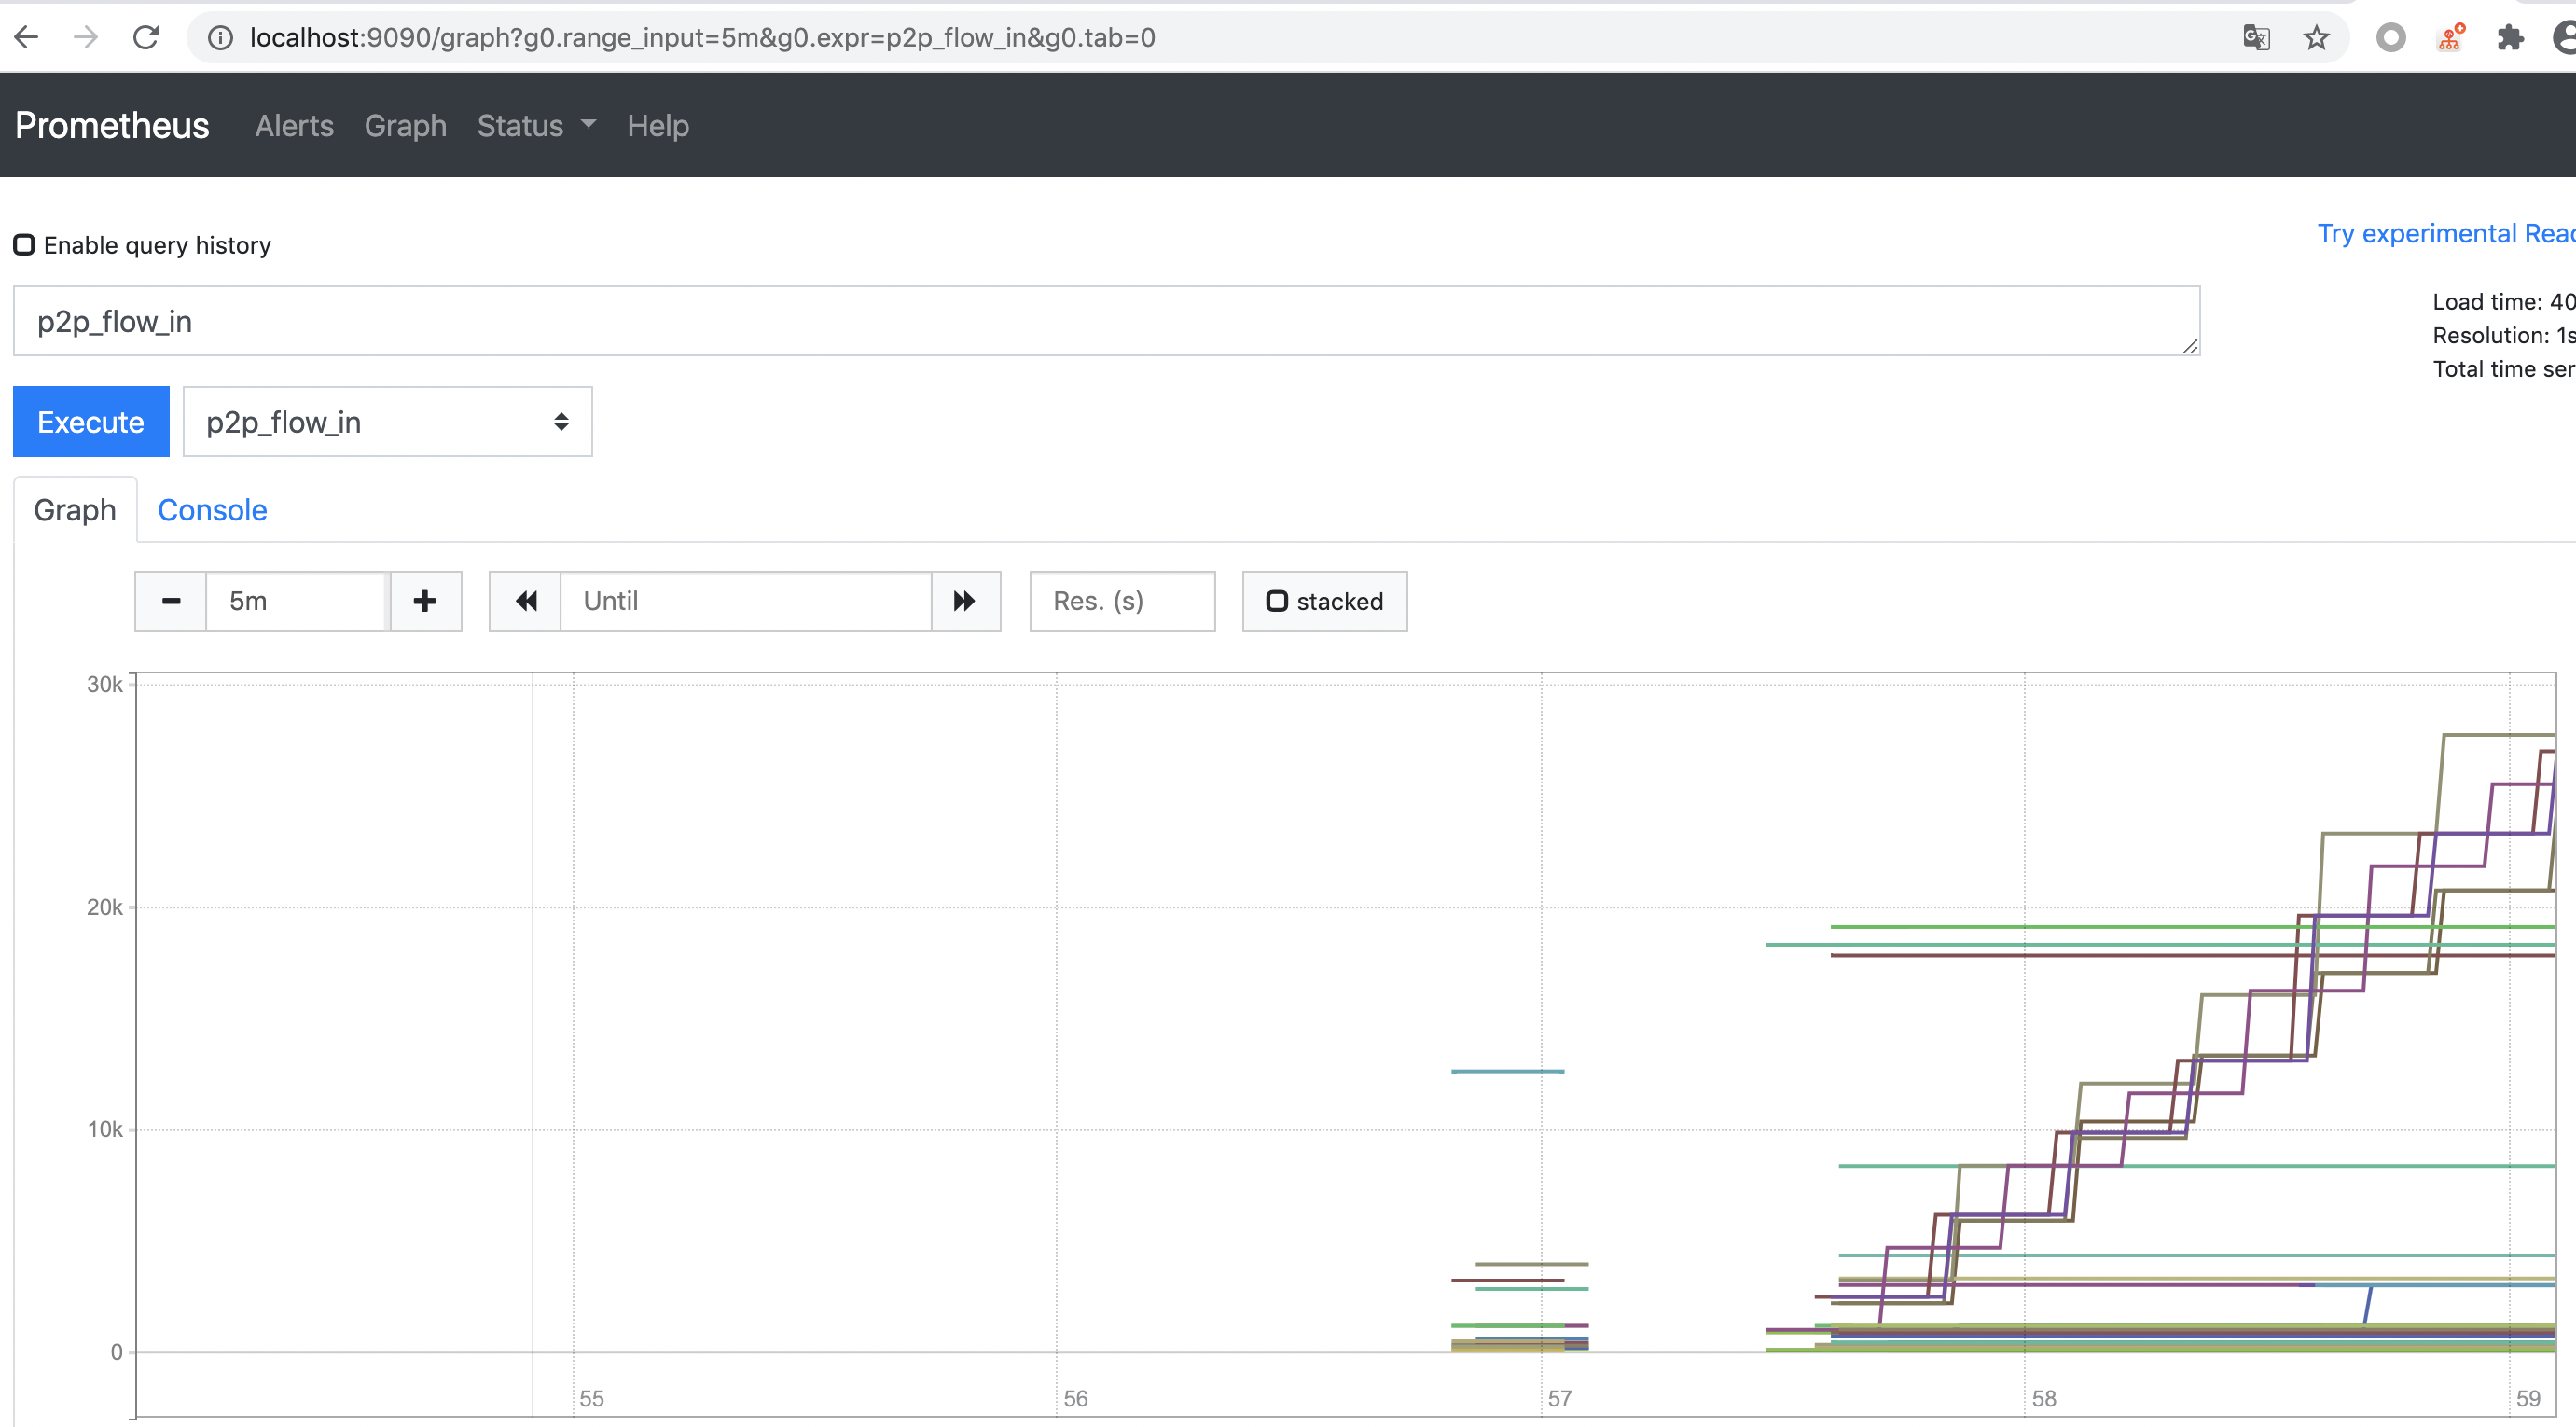
查看流量信息(以流量监控信息为例):
p2p_flow_in
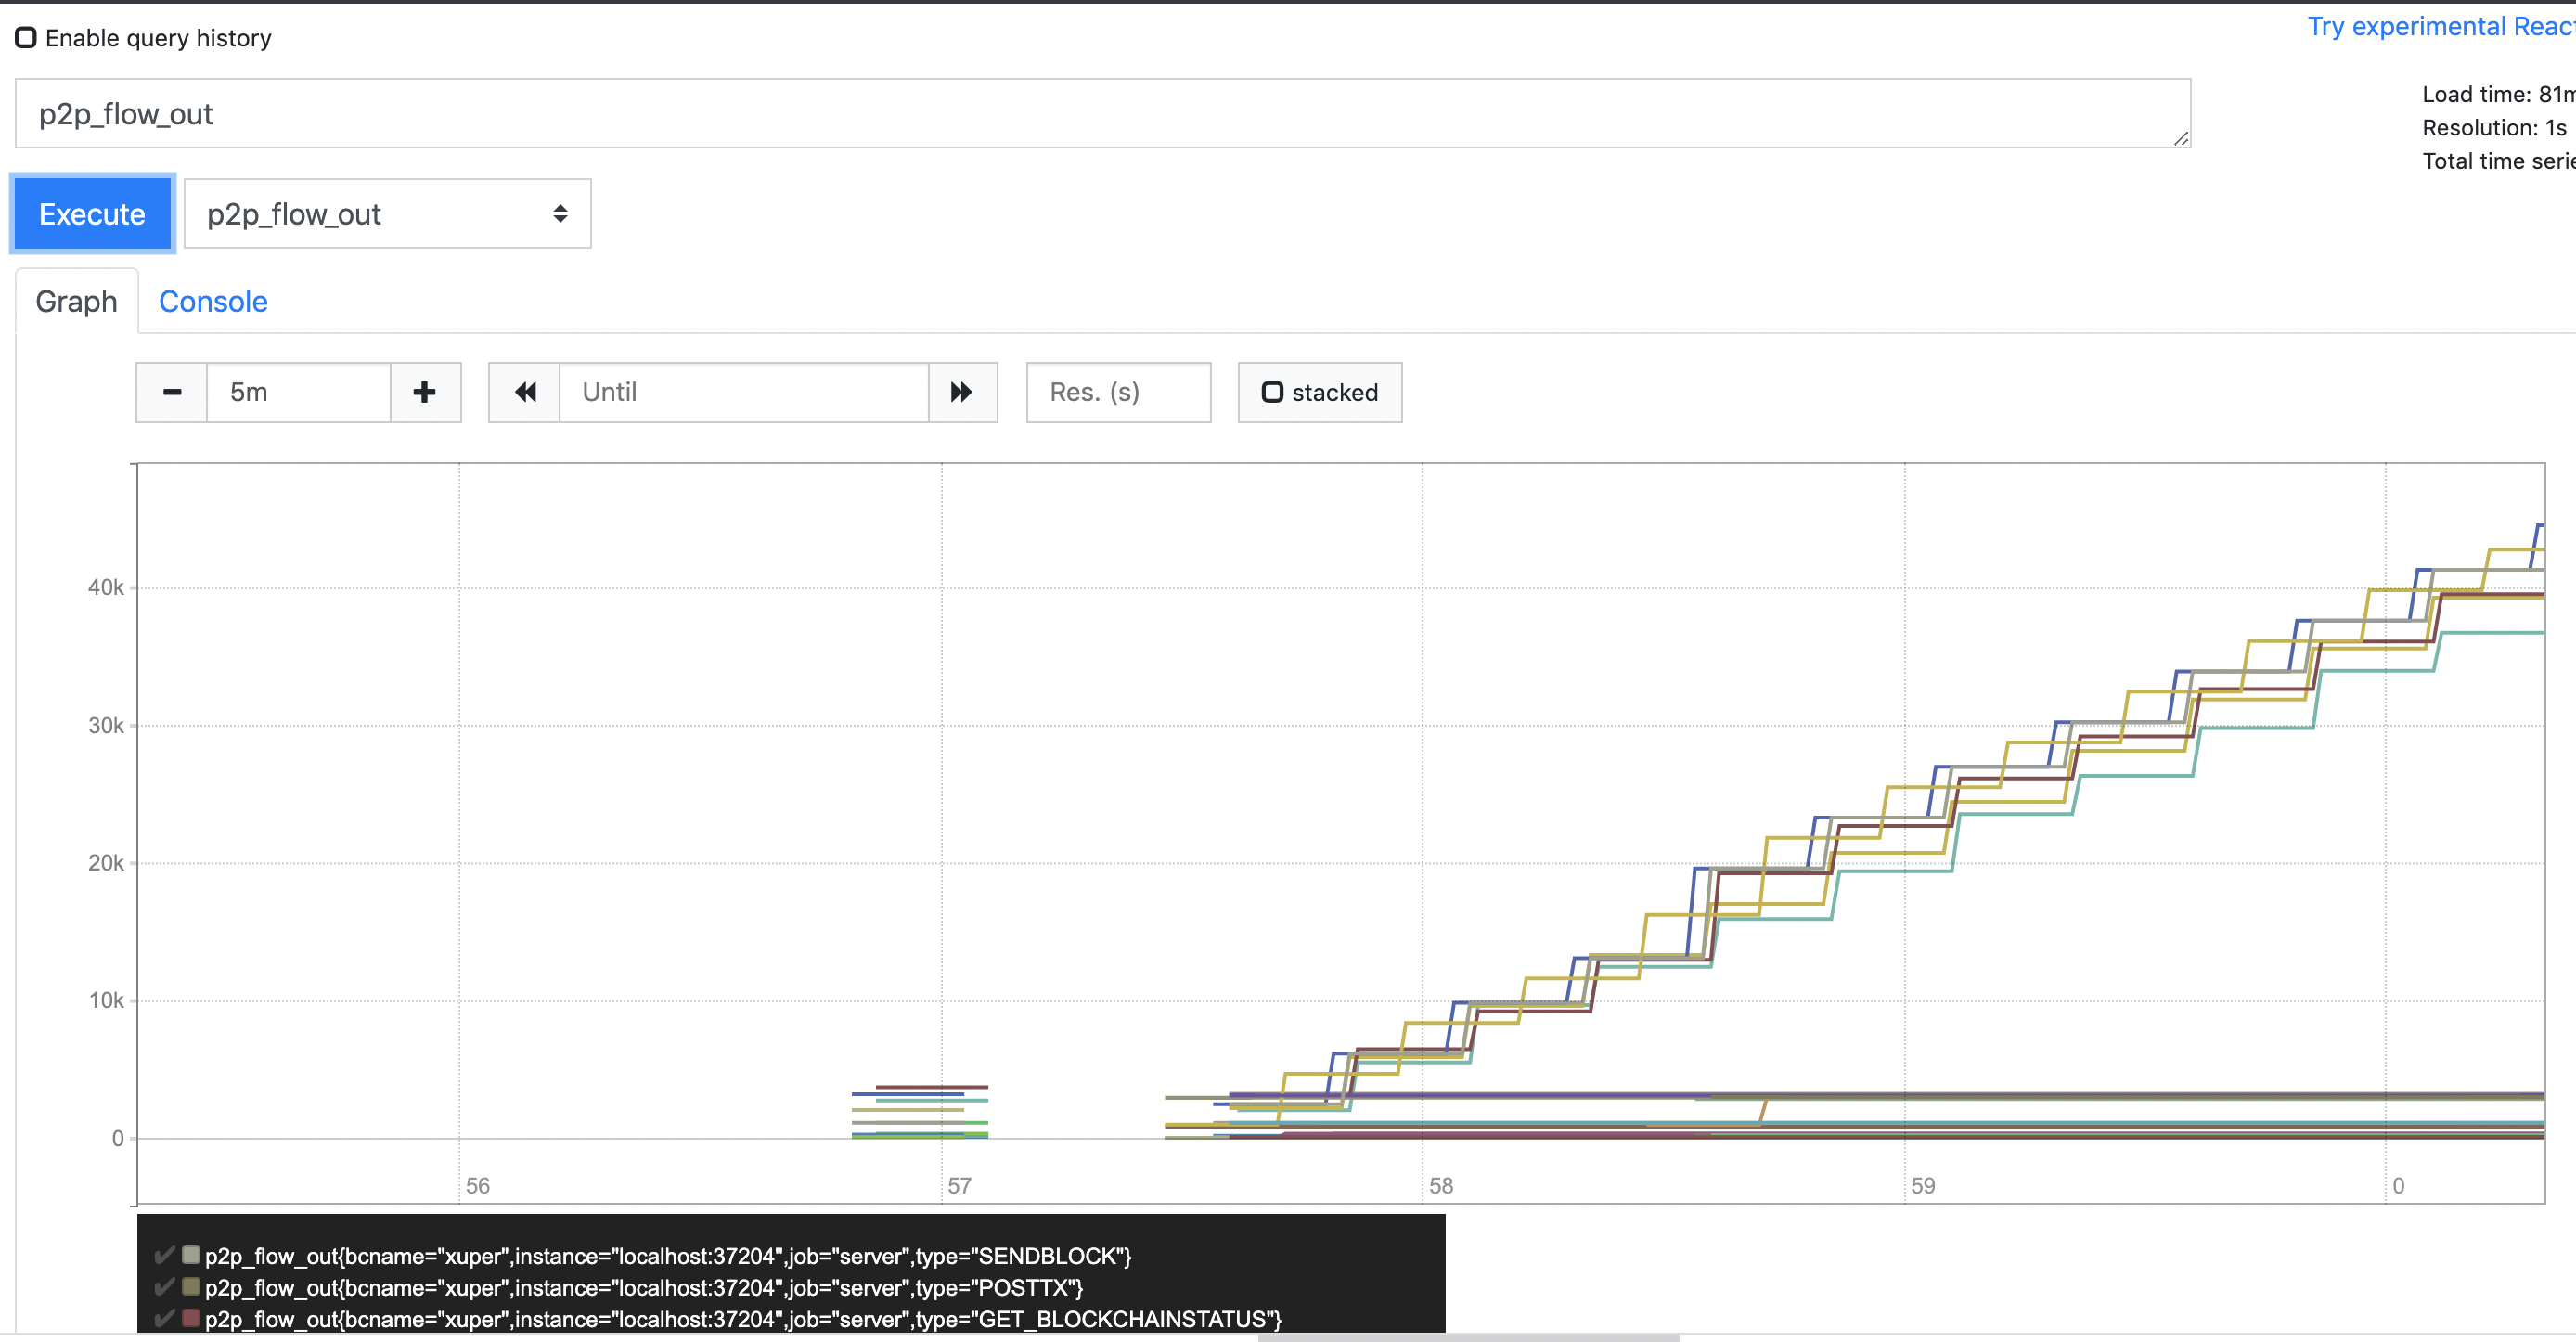
p2p_flow_out
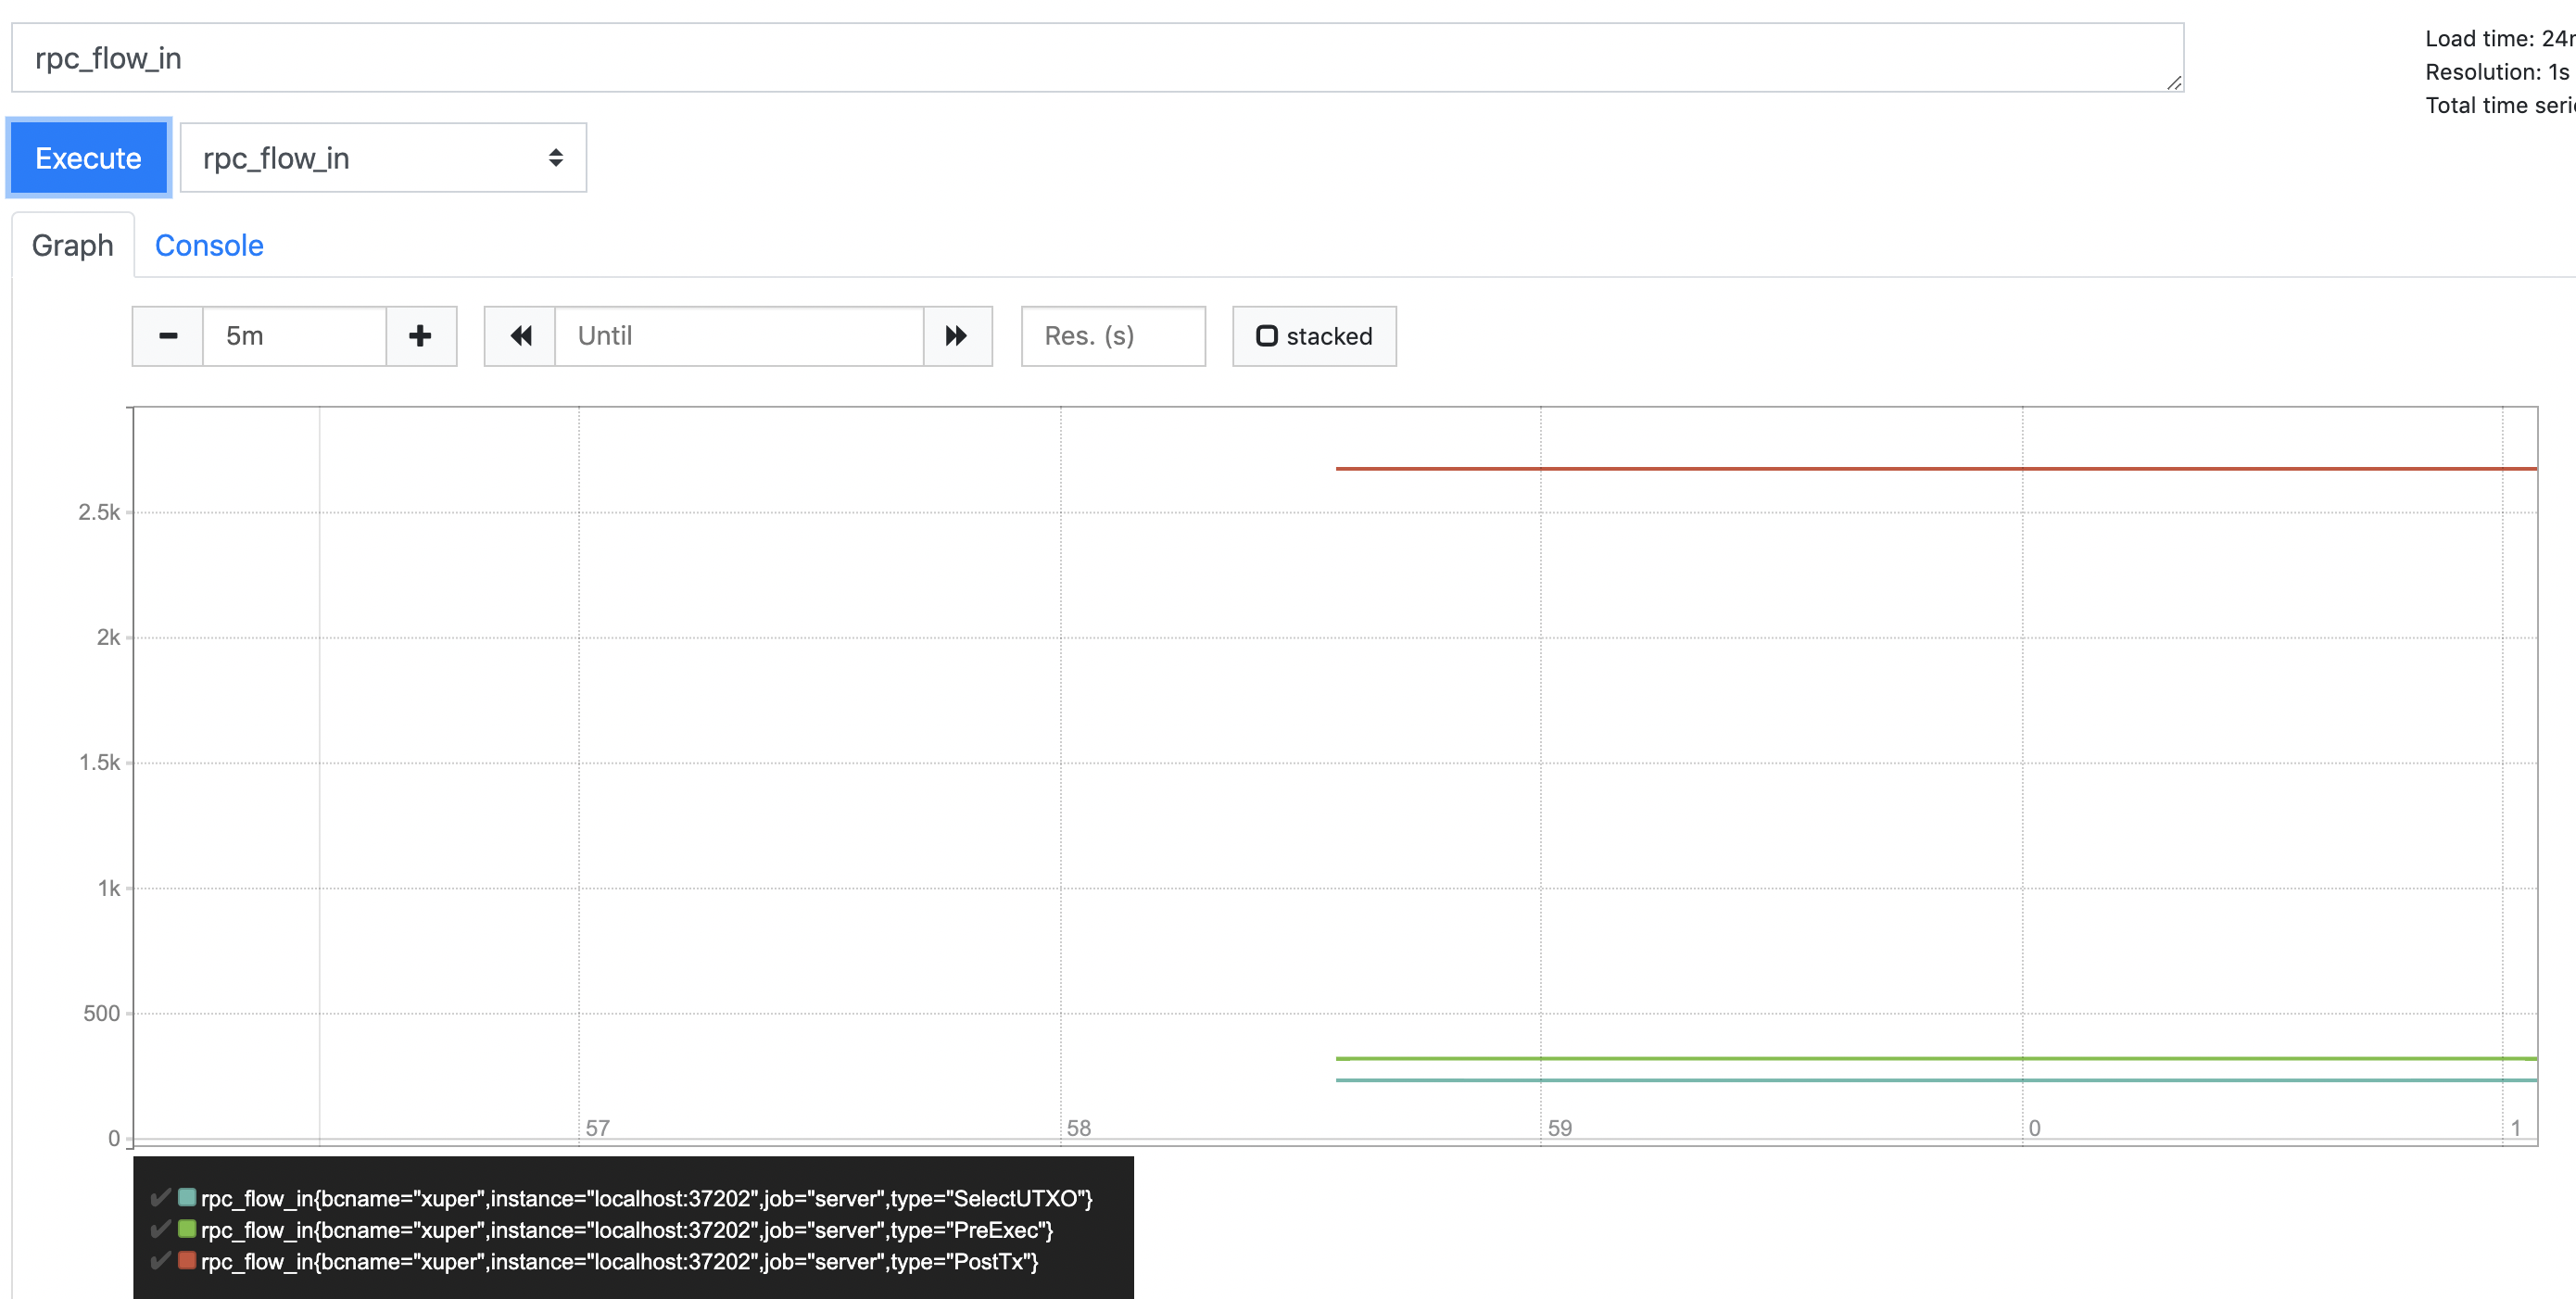
rpc_flow_in
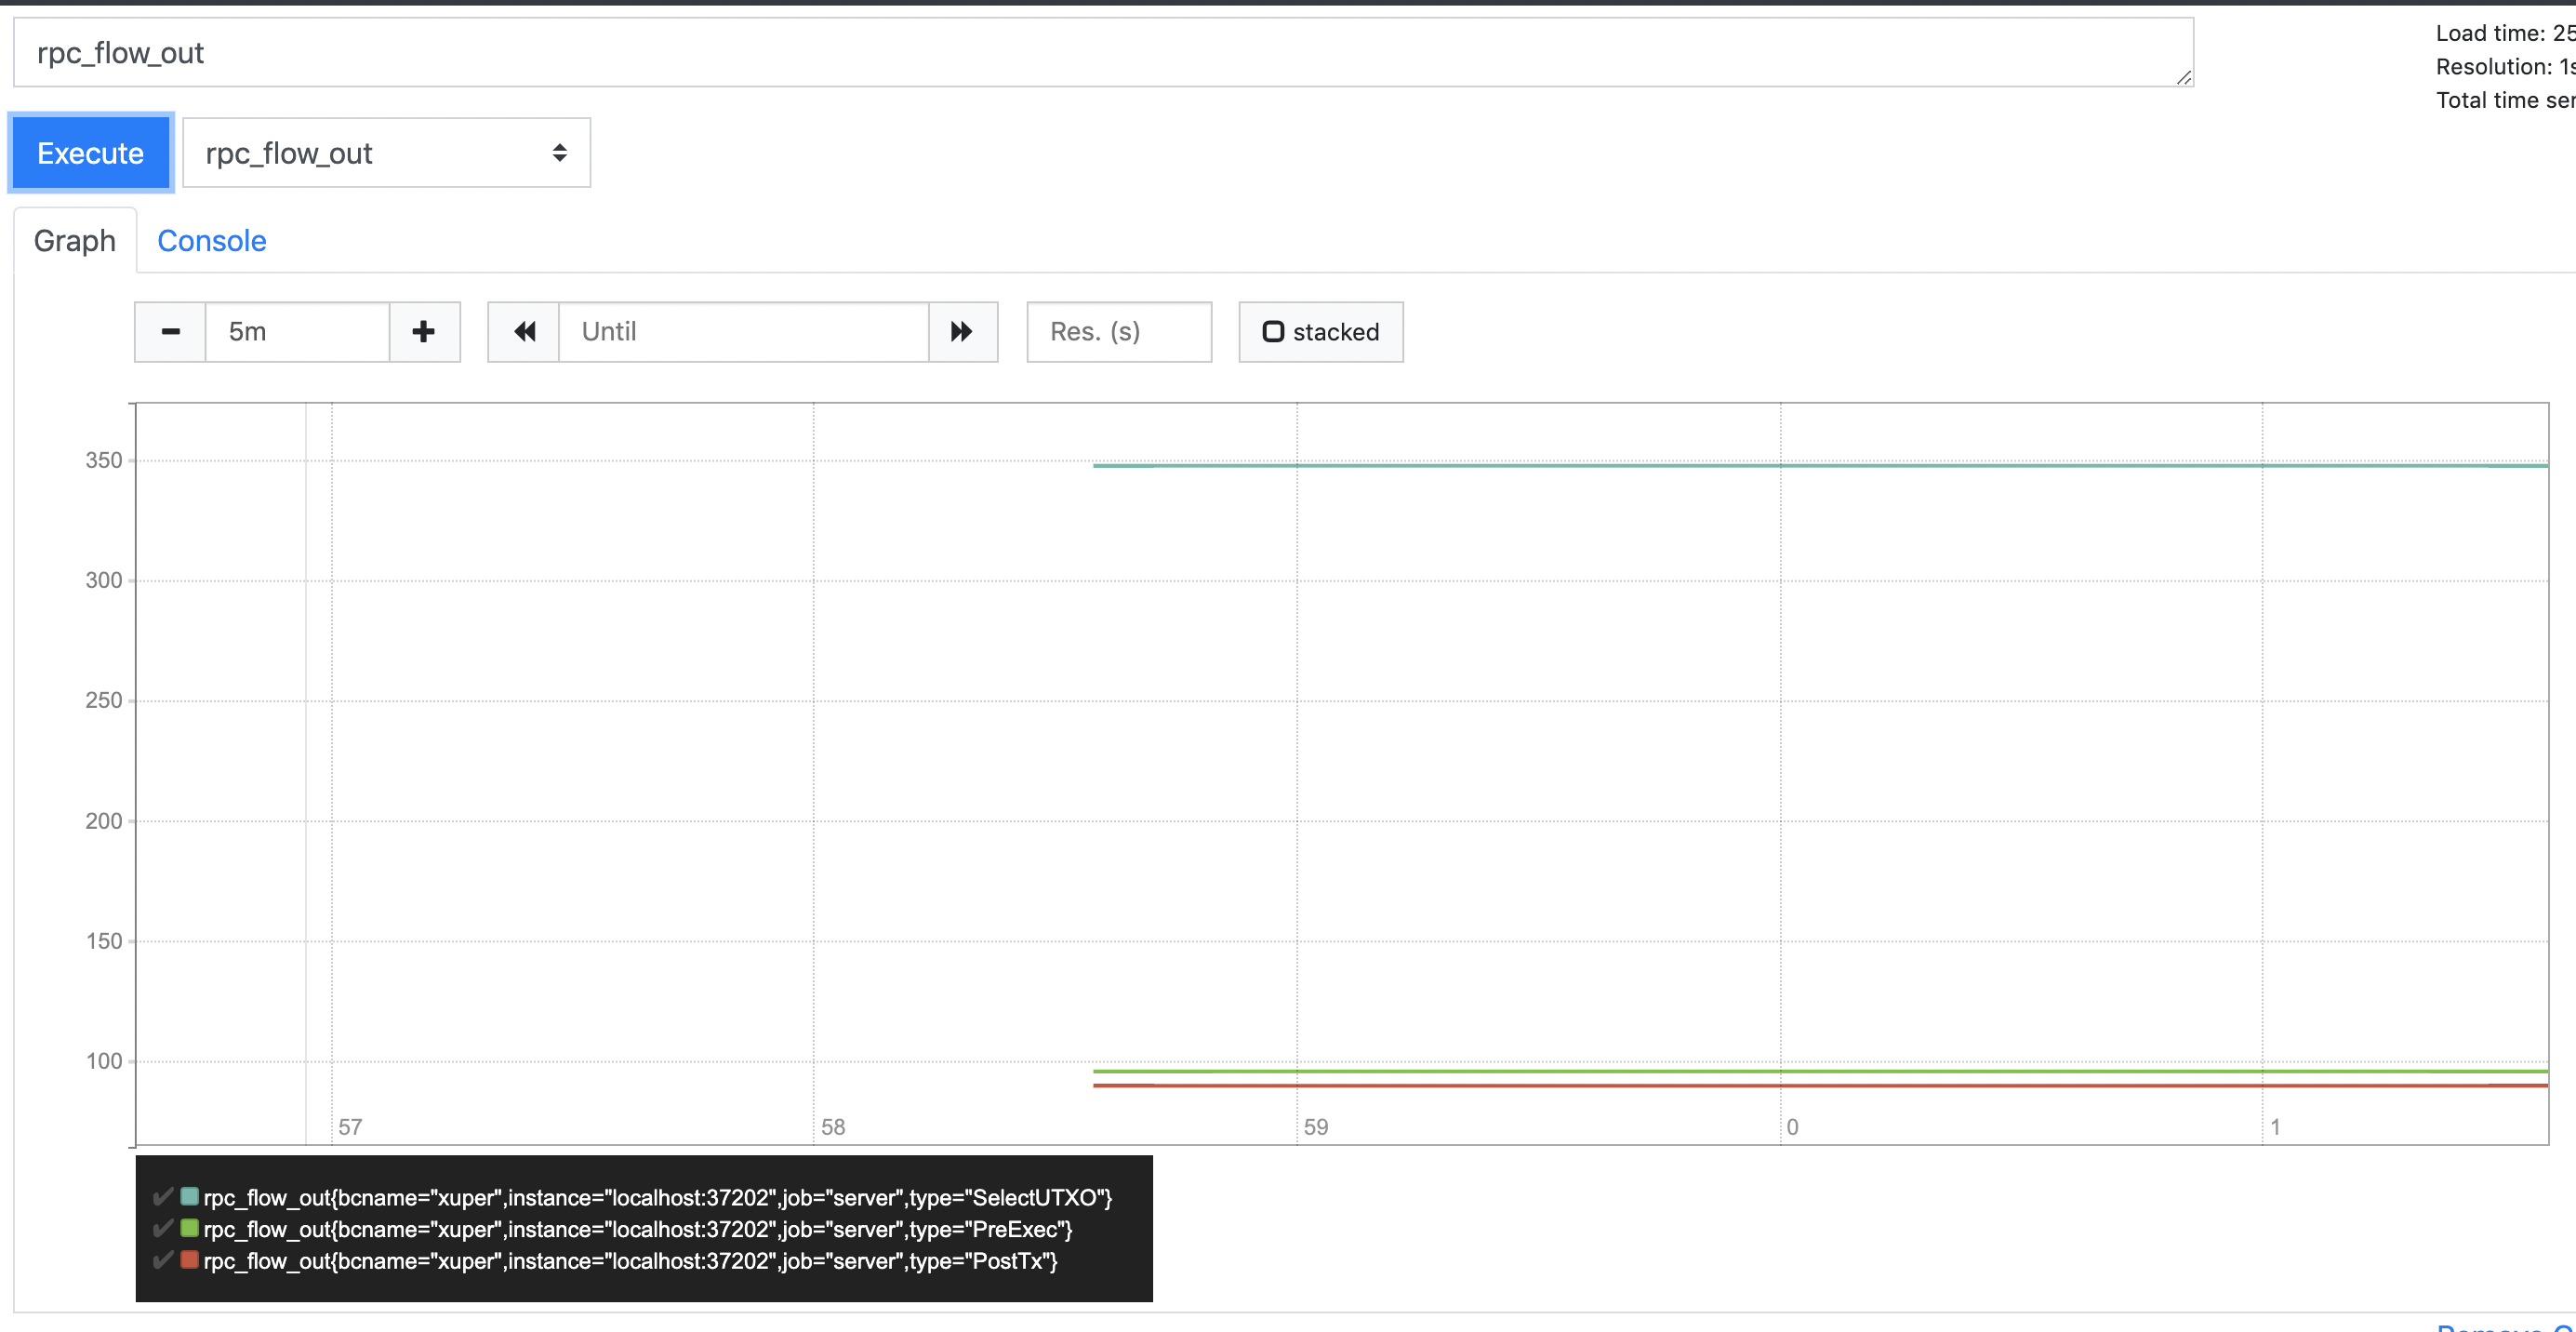
rpc_flow_out
12.2.3. 使用Grafana查看监控
因为Prometheus的界面看起来非常简单,我们还可以通过Grafana这个非常强大也是最常用的监控展示框架。
12.2.4. 使用接口查看监控
Prometheus提供了一种功能查询语言PromQL(Prometheus查询语言),它允许用户实时选择和聚合时间序列数据。同时为了方便外部系统调用,还提供了HTTP API能力。
详情请参考: https://prometheus.io/docs/prometheus/latest/querying/api/